| Project Summary | |
|---|---|
| Title | “Teaching Graph Traversal Visually” |
| Language | Python |
| Report | Download PDF |
| Code | Repo Link |
Table of Contents
# Background
Princeton requires all students in its A.B. (or Bachelor of Arts) program to complete independent work during their junior and senior year. As a junior in the computer science department, I completed two separate junior papers during each semester.
For my spring junior paper, I enrolled in an independent work seminar focused on the teaching of computer science. While each student worked on their own project, the seminar met together once a week in order to discuss their progress and ideas. I had worked by myself the previous semester, so it was a nice change of pace to be able to talk with others about my project. I decided to create an assignment that would teach students the breadth-first search (BFS) and depth-first search (DFS) algorithms.
# Visualizing Graph Algorithms
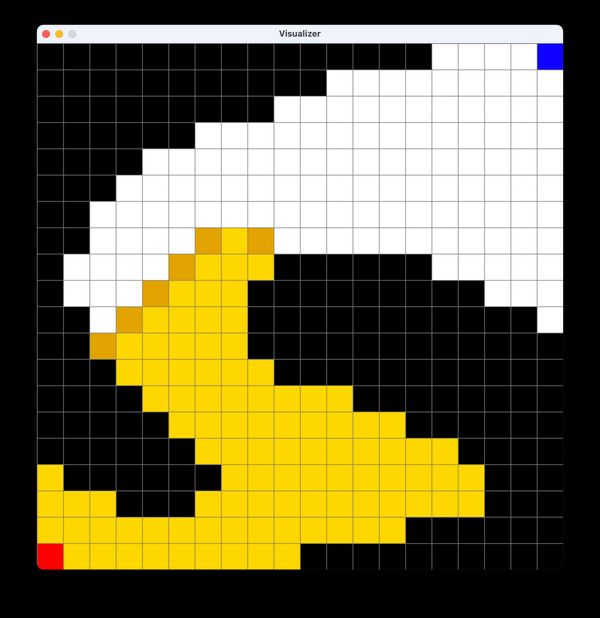
I knew from the beginning that I wanted my assignment to be interactive. It had to have a visual component, in order to allow a student to actually see a given algorithm in action. Given the focus on accessibility and learning, I chose the Python programming language with pygame as my scaffold for visualization.
Pygame makes it relatively simple to draw graphics, but this simplicity also required me to implement features a more complex engine would provide out of the box. A single 319-line script called visualizer.py handles all drawing, state management, and input handling. The graph is represented as a 2D array of nodes, where each node maintains a list of neighbors. In order to demonstrate an algorithm, the user runs the script in the terminal with either the bfs or dfs flags. This opens a new window displaying the graph. By clicking the graph with the left mouse button, certain nodes can be blocked off. After pressing the spacebar, the algorithm will be run on the graph step-by-step.
# Creating an Assignment
While the visualizer program provided a framework for my project, the task of using it in an assignment remained. The visualizer maintained its own algorithm implementations for use in demonstration. This meant that students would need an entry point through which to write their own versions of BFS and DFS. This is provided in a separate file called solutions.py that is imported at runtime, which looks like this:
# Depth-first search
def dfs(node, explored):
  pass

# Breadth-first search
def bfs(start, goal):
  pass
When the visualizer is run with the -t flag it functions almost identically to the demo mode; the only difference is that it will compare the output with the reference solutions. If there is an error in the student solution, the visualizer will attempt to display a corresponding error message before exiting the program.
The actual assignment is structured as a GitHub repository, with the specification contained in its README. This made it easy work on the assignment, since everything could be handled in the terminal:
# Set up workspace and test visualizer
mkdir mysolutions
cd mysolutions
git clone MY-REPO-URL .
python3 -m venv env
source env/bin/activate
python3 -m pip install -r requirements.txt
python3 visualizer.py bfs
deactivate

# Work on assignment...

# Submit assignment
git add .
git commit -m "Submission"
git push -u origin master
# Evaluation
I was able to get nine real Princeton students to complete my assignment. Feedback was collected in a file called submission.md and included with their final repository code. Overall, I was pleasantly surprised at the reception I got. While many participants said the assignment was short (under two hours), they appreciated it as a refresher to graph algorithms. Almost everyone found the instructions clear and appreciated being able to visualize each algorithm. A full analysis of their feedback and the project as a whole is included in my final written report.
Overall, I appreciated the chance to do something like this. Many times in my Princeton career have I wondered about the teaching aspect of my courses. This project was a chance for me to be the professor for a change.
The source code for this project and instructions on how to run the final application are available online at https://github.com/thisstillwill/IW-Spring-2021.